Campaign statistics
- To view the statistics of your existing campaigns, go to the “Campaigns” section on the left side of the site. Here you can see a list of campaigns you have created.
- To view the statistics of any campaign, go to the “Statistics” section of the relevant campaign.
- The “Statistics” section consists of 3 parts:
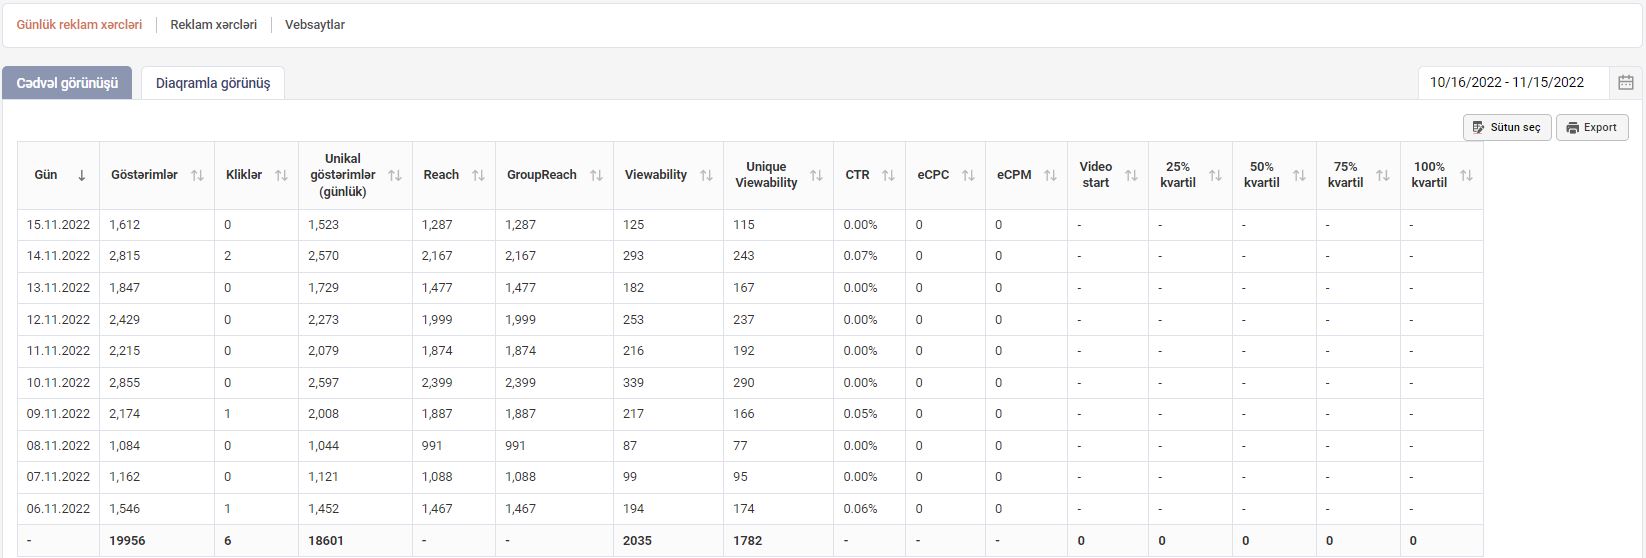
3.1 Daily advertising costs
In this section you can get acquainted with the daily indicators of advertisements placed within the selected advertising campaign. These indicators are as follows:
Indications – The number of views per day of the ads in the selected campaign
Clicks – The number of clicks per day for the ads in your selected campaign
Unique views – The number of unique views per day of the ads in the selected campaign. For example, if your ad has been viewed 5 times by 1 viewer, that number of views is counted as 1 number of views in this section.
Unique clicks – The number of unique clicks per day for the ads in the campaign of your choice. For example, if your ad is clicked 5 times by 1 viewer, those 5 clicks are counted as 1 click in this section.
CTR – The ratio of the number of views to the number of clicks of the ads in the selected campaign
Reach –
GroupReach –
3.2 Advertising expenses
In this section, you can get information about the amount of money spent on each size of ad in the selected campaign
3.3 Websites
In this section you can find information on which sites the ads of the selected advertising campaign are broadcast.
You can also get acquainted with the statistics of the above-mentioned sections in graphical format. To do this, go to the “Schedule Report” section in the selected section.
If you would like to get information about the specific statistics, you can activate the indicators in the “Select Columns” section at the top of the page